Enhanced Decision Making capabilities, delivered with data-driven research at your fingertips.
Connect With UsData-Driven Impact
For four decades, Business Intelligence by Mohr Partners has strengthened decision models globally. Our Business Intelligence service suite is the key to analyzing the right data and making the right decisions.
The core tenets of our Business Intelligence platform are actionability and sustainability. We emphasize data that drives positive change. We refocus strategies on analytics that project impact. We deliver insights that transform into results at the center of our methods.
As a trusted partner for numerous clients, we have consistently and dependably formulated and produced decision-making strengths. From data you can interact with to learnings you can implement today, our goal is always to combine the agility of technology with the evolution of growth.
All tailor-made to your unique challenges.
Replace silos with a single source of truth.
Unify every critical dataset into one reliable hub: demographics, competitive footprints, mobility patterns, utilities and power, incentive options, and lease obligations.
A single view eliminates conflicting reports, reduces copy-paste errors, and shortens review cycles. Teams stop debating numbers and start evaluating choices. Decisions become comparable, auditable, and faster to approve.
Speed decisions without sacrificing rigor
Leverage interactive dashboards that combine verification with clarity. Each metric is sourced, timestamped, and drillable to property records, comps, and assumptions. Non‑technical users can filter by market, size, or rent band; analysts can open the underlying data. This shared canvas supports working sessions that resolve questions in minutes, not hours.
Rigor is preserved through standardized calculations, version control, and commentary threads. Forecasts show base, downside, and upside paths using rent growth, absorption, deliveries, and employment inputs. Tooltips explain formulas; audit trails capture changes. Stakeholders leave the session with aligned scenarios, documented decisions, and next steps tied to owners and timelines.
Win negotiations with evidence.
Enter negotiations with tenant‑grade evidence, not anecdotes. Benchmark effective rents, concessions, and escalation patterns by submarket and asset type. Overlay vacancy, sales velocity, and pipeline deliveries to show true leverage. Geospatial layers clarify access, competitors, and utilities. The conversation shifts from opinions to facts the landlord cannot dismiss or ignore.
Support counteroffers with side‑by‑side variance analytics: first ask, latest proposal, recommended position, and value captured to date. Tie each point to comps and modeled cash flows. Present risk mitigants and tradeoffs transparently. This disciplined package expedites legal review, protects must‑have clauses, and secures economics that align with strategy and governance.
Scale consistently
Build once, deploy everywhere. Start with a pilot MSA to prove metrics, governance, and workflows. Document data sources, refresh schedules, and quality checks. Create reusable templates for scorecards, dashboards, and variance reports. When expansion begins, new markets inherit the same definitions and layouts, avoiding stalls and relearning across teams consistently.
Scale adds support, not complexity. Role‑based permissions, intake forms, and change logs keep control as users and assets grow. Quarterly model reviews maintain relevance; training keeps non‑technical users confident. Executive views roll up KPIs; local views stay actionable. The experience is predictable, auditable, and easy to onboard at any scale.
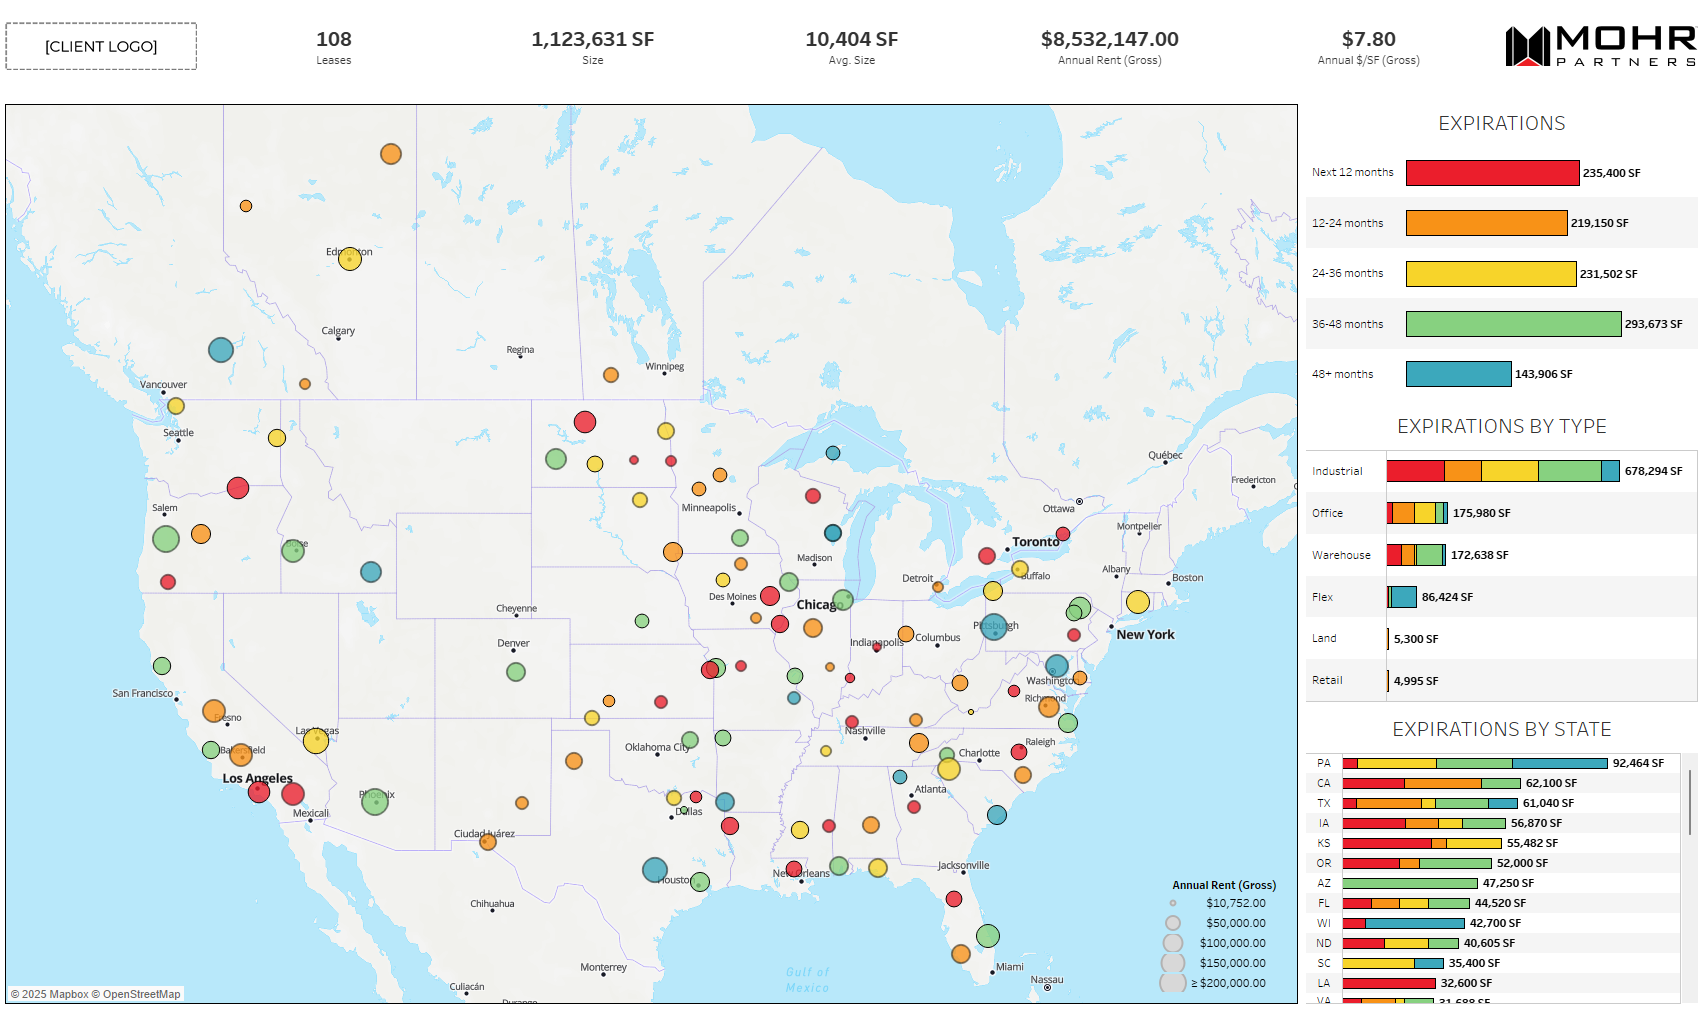
Visualize and manage your real estate portfolio across regions, property types, and critical dates with a focus on financial performance, lease exposure, and strategic alignment.
This dashboard helps identify opportunities for optimization by benchmarking lease terms, uncovering market outliers, and aligning location performance with business goals.
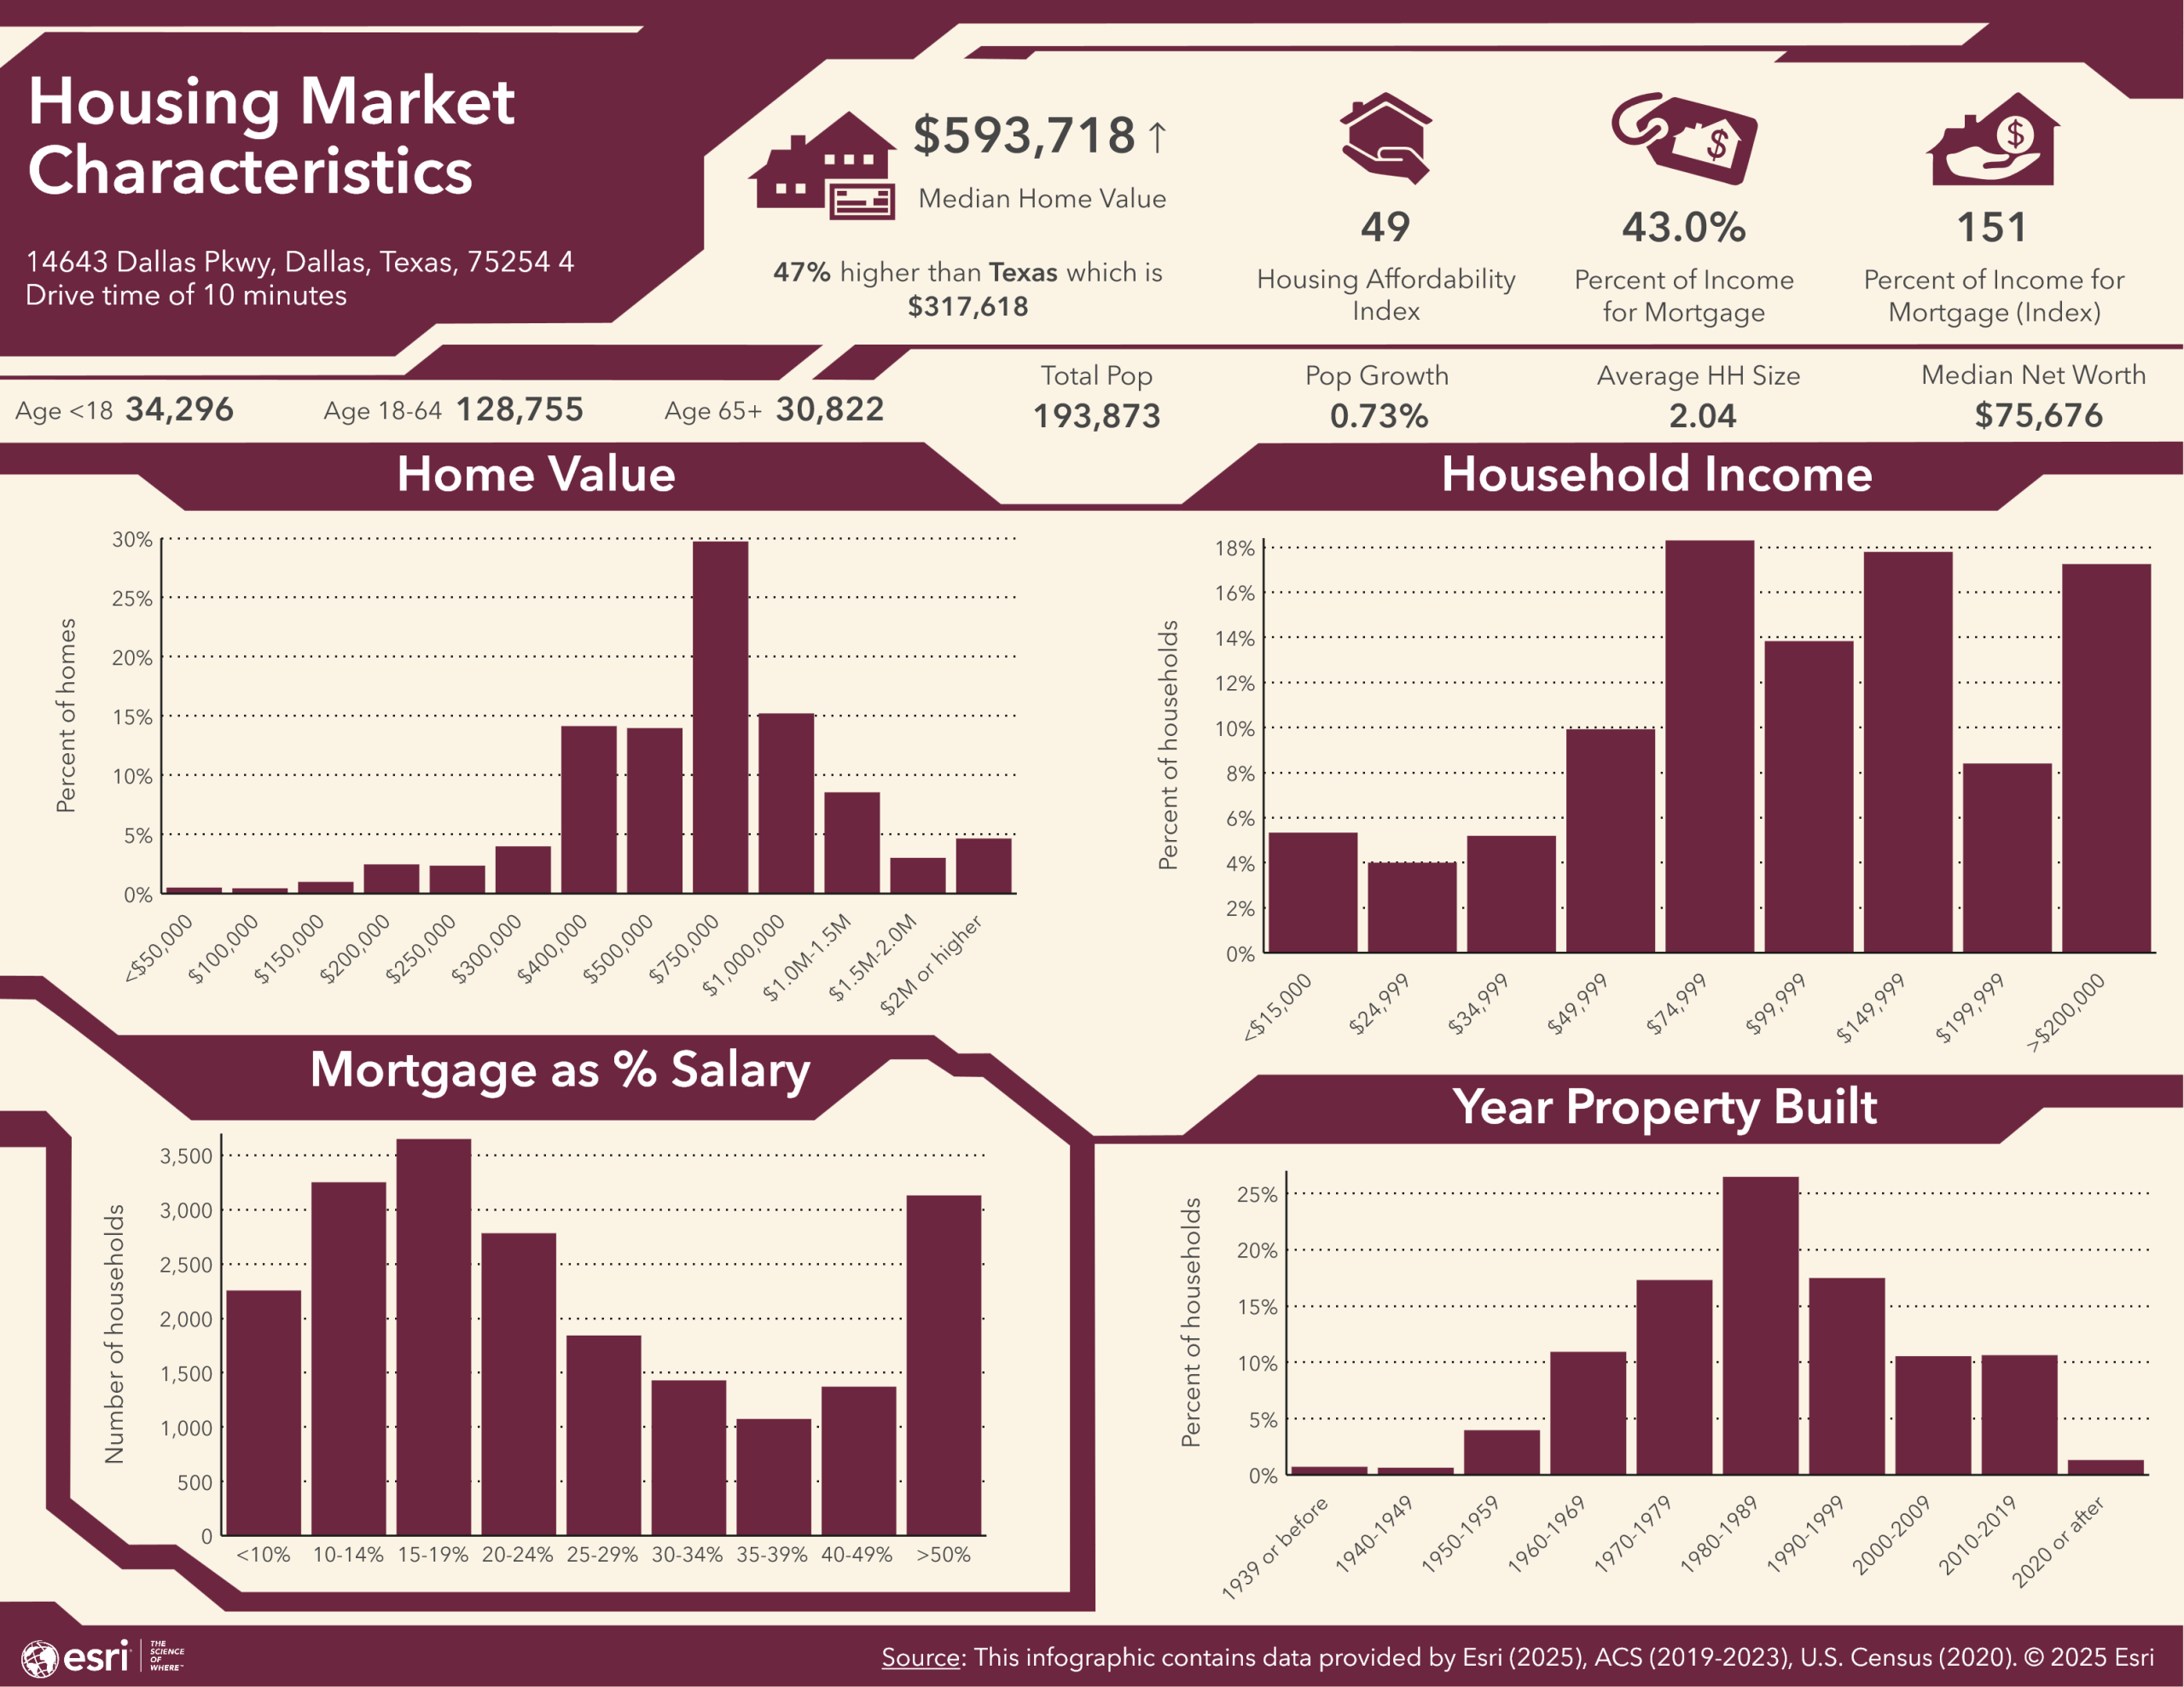
Obtain a clear snapshot of the housing market in your target area – tracking trends in pricing, supply, demand, and time on market.
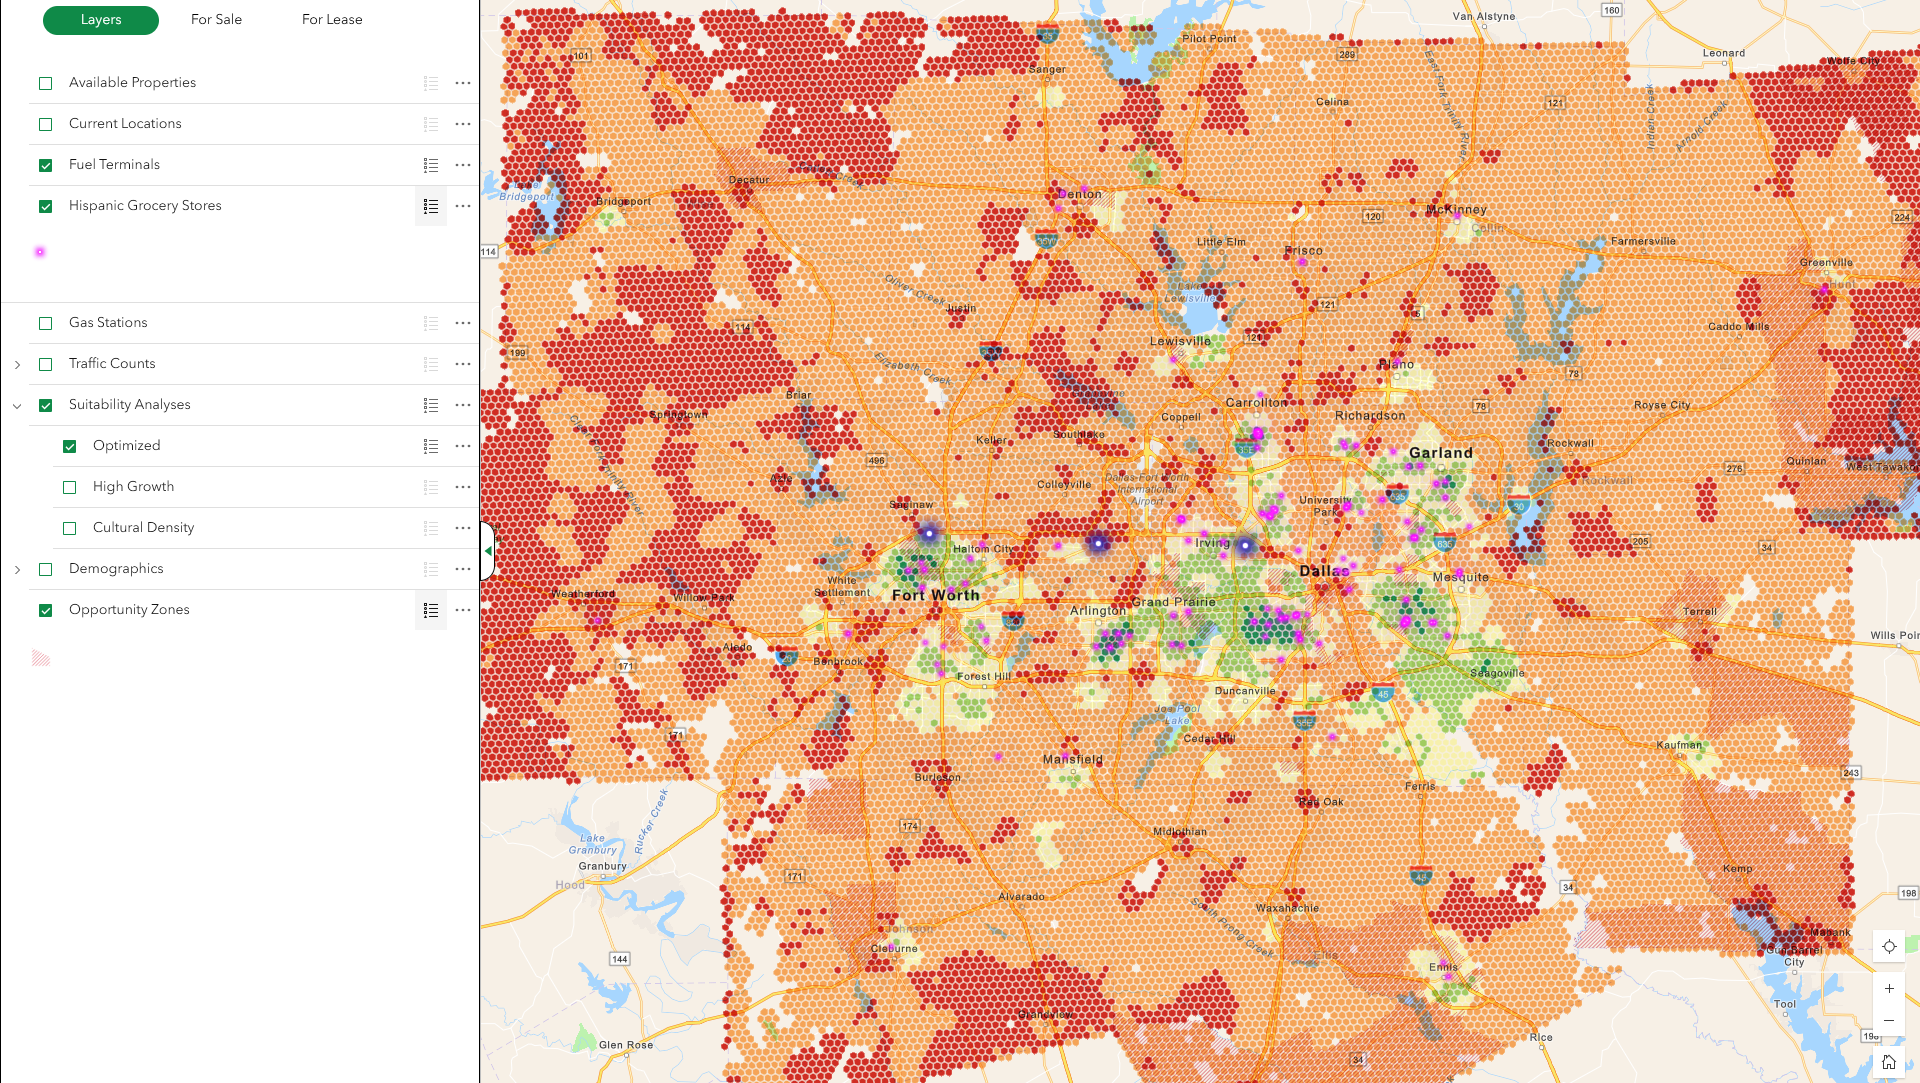
Spot opportunities, gauge risk, and discover areas of growth to decide where to invest or develop your business.
Use this to gauge general growth in an area, and establish yourself in the best markets.
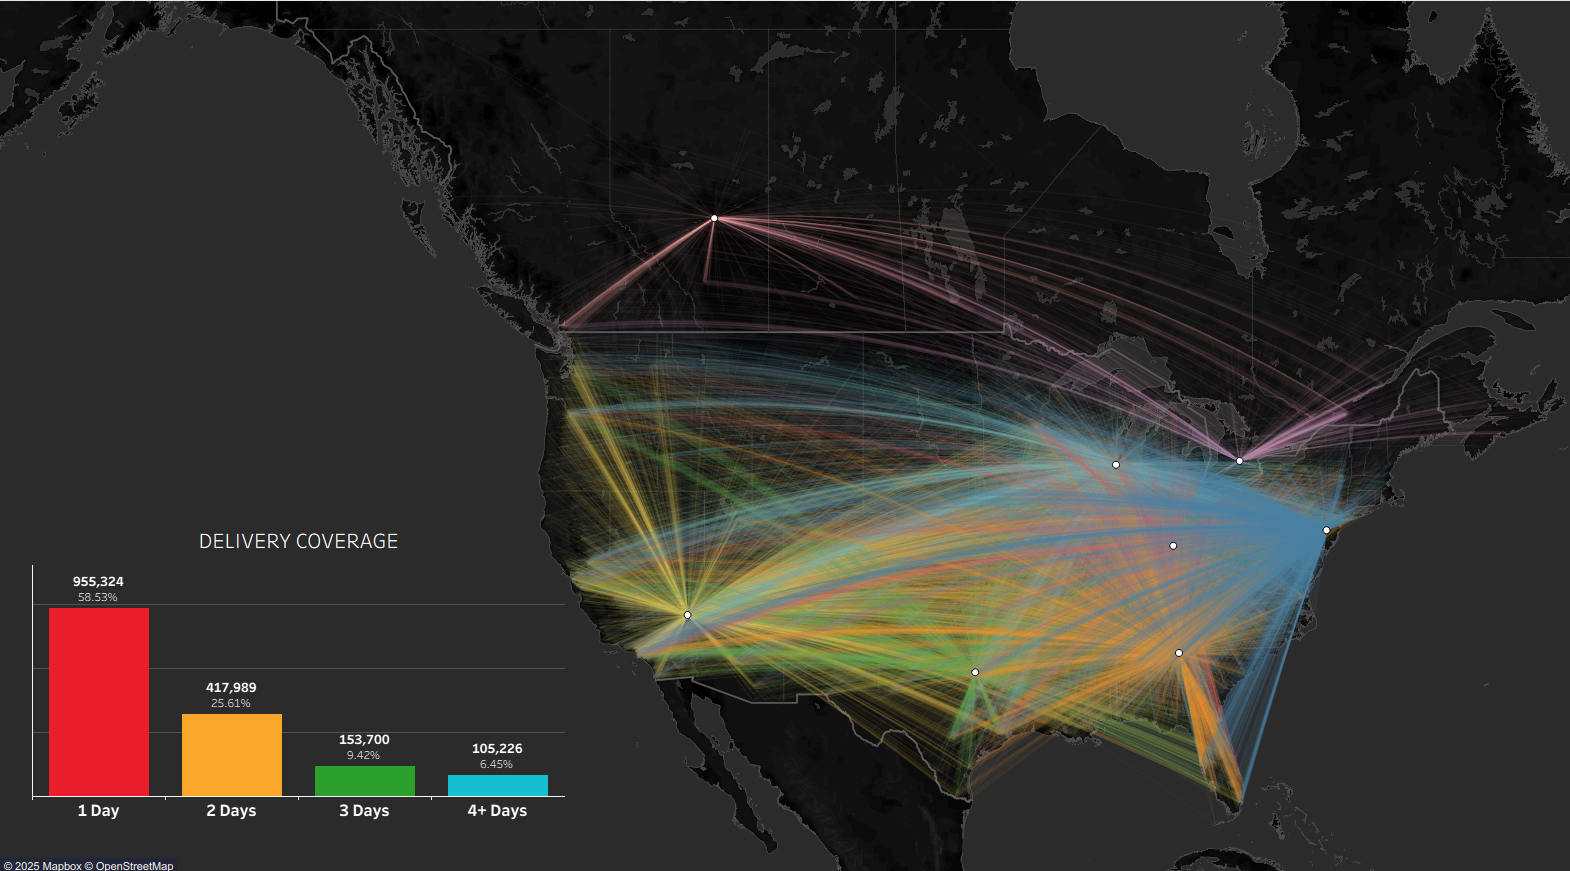
Highlight bottlenecks, map delivery zones, and make smarter decisions on routes, warehouses, and inventory levels.
Reduce costs, increase speed, and prepare for disruptions with a clear, data-driven logistics strategy.
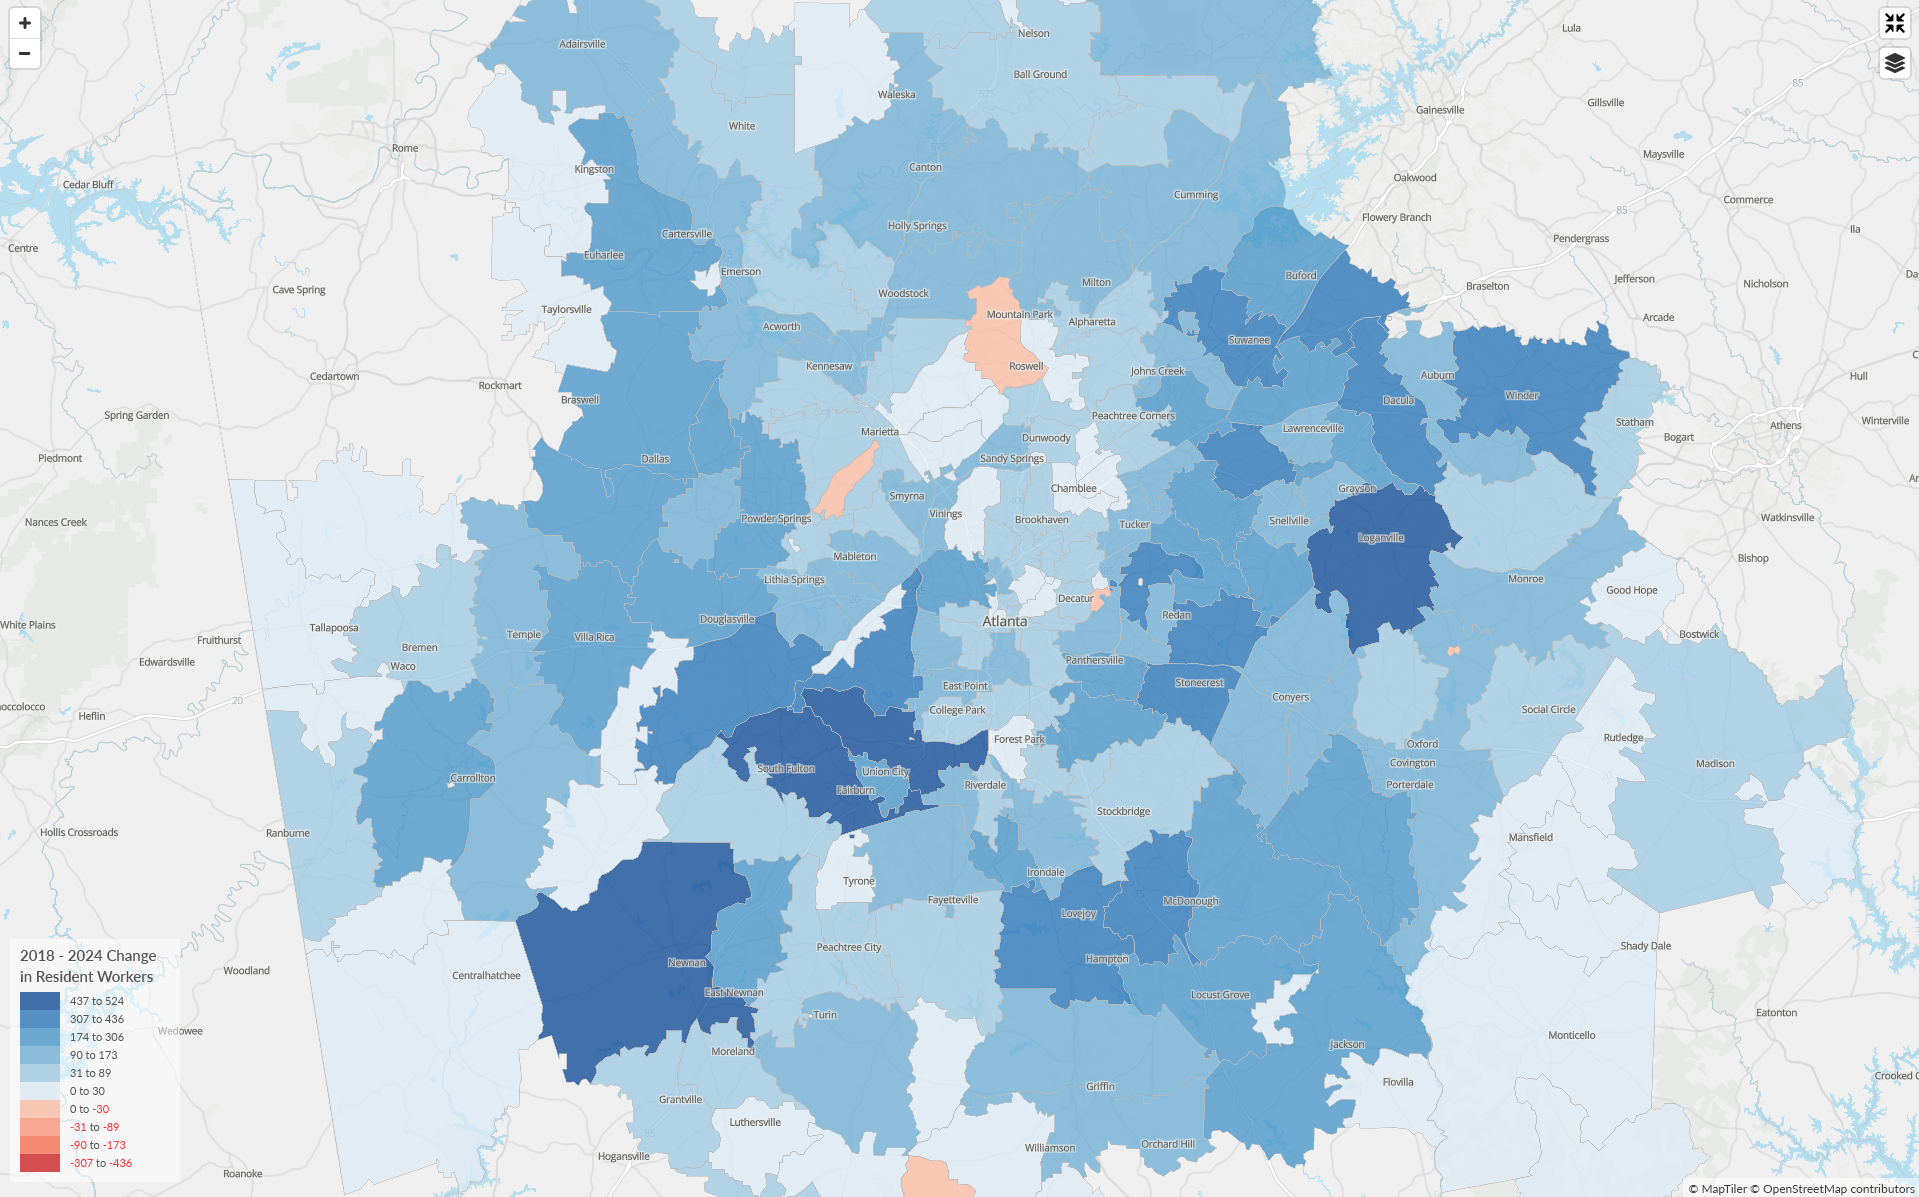
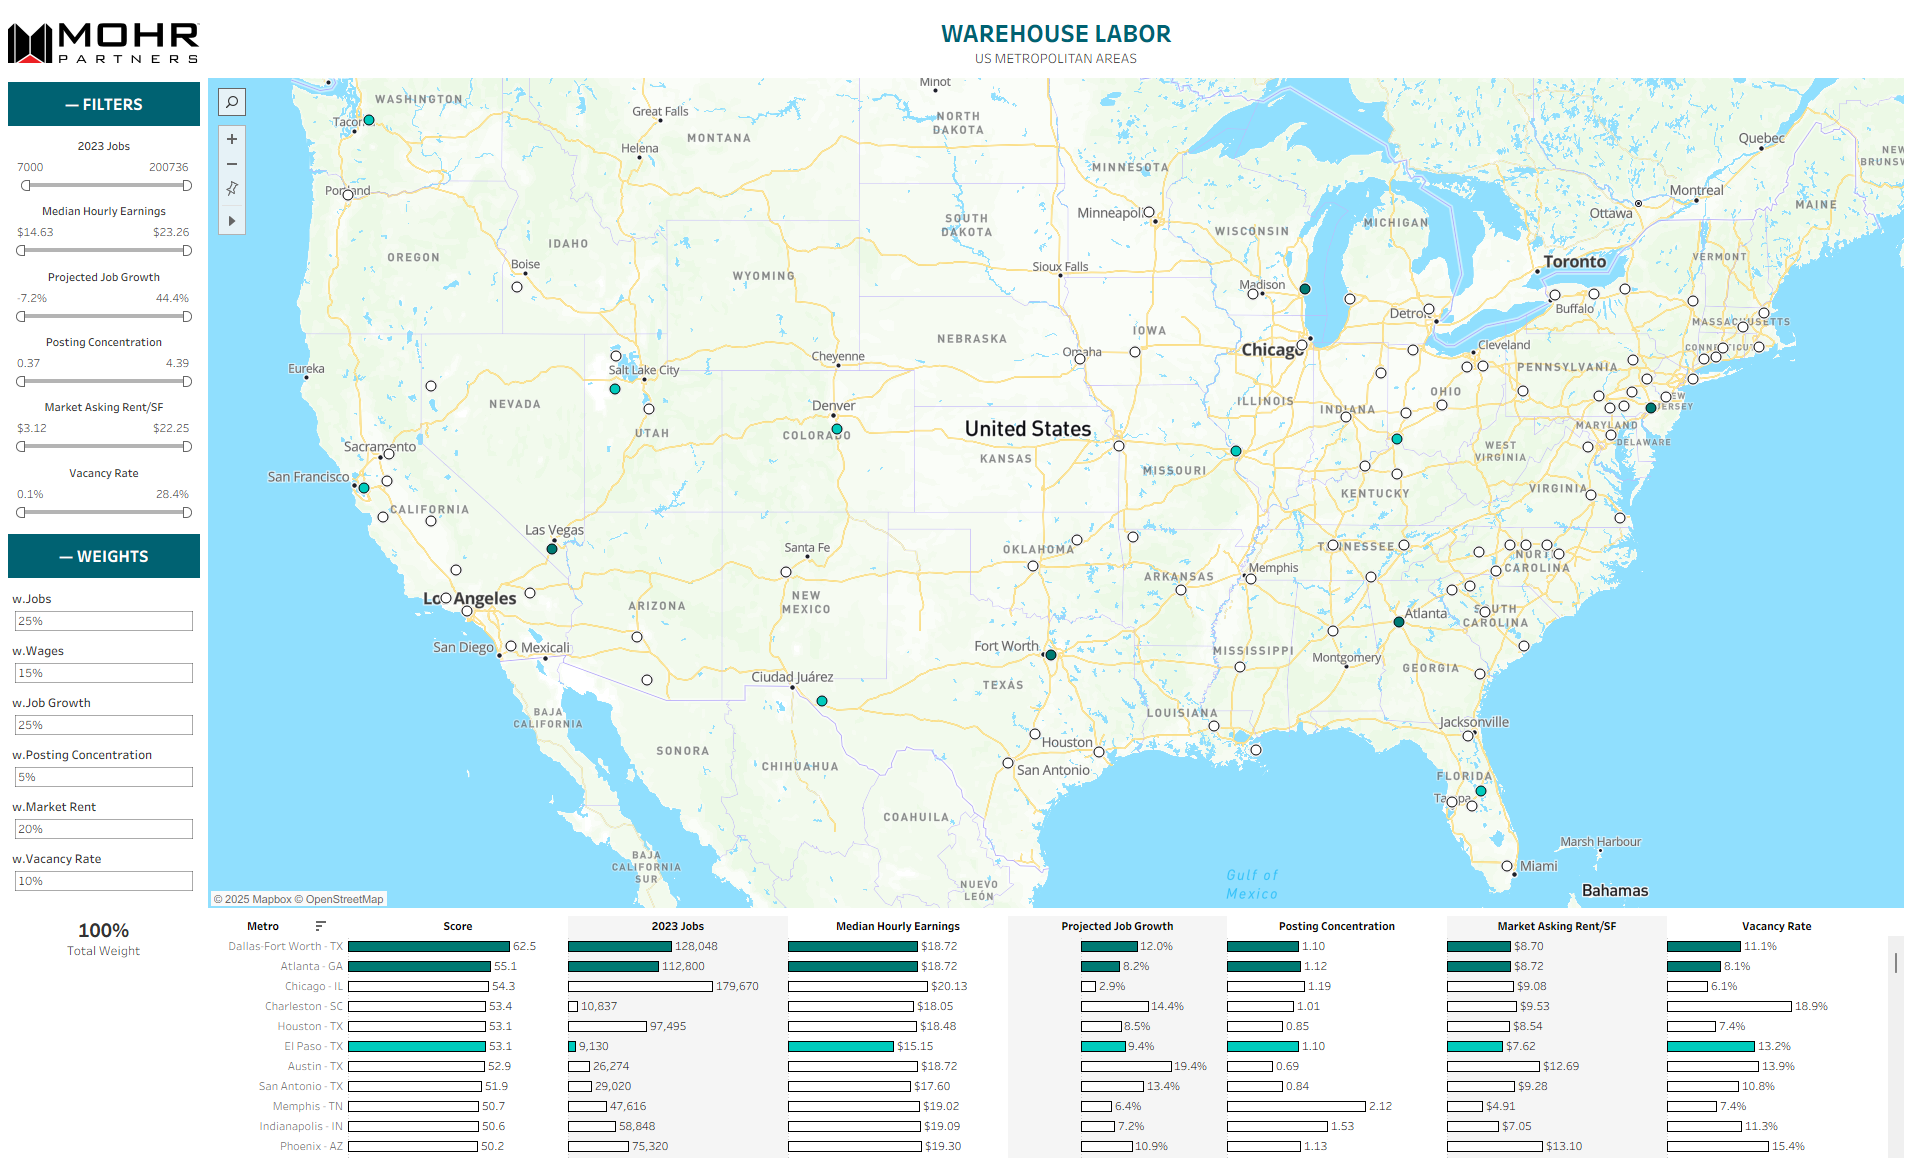
Understand the workforce in your target area: its availability, common skills, typical wages, and local competition.
This deliverable helps you plan office locations, hiring strategies, and expansions by showing where the right talent lives and how much it will cost to hire and keep them.
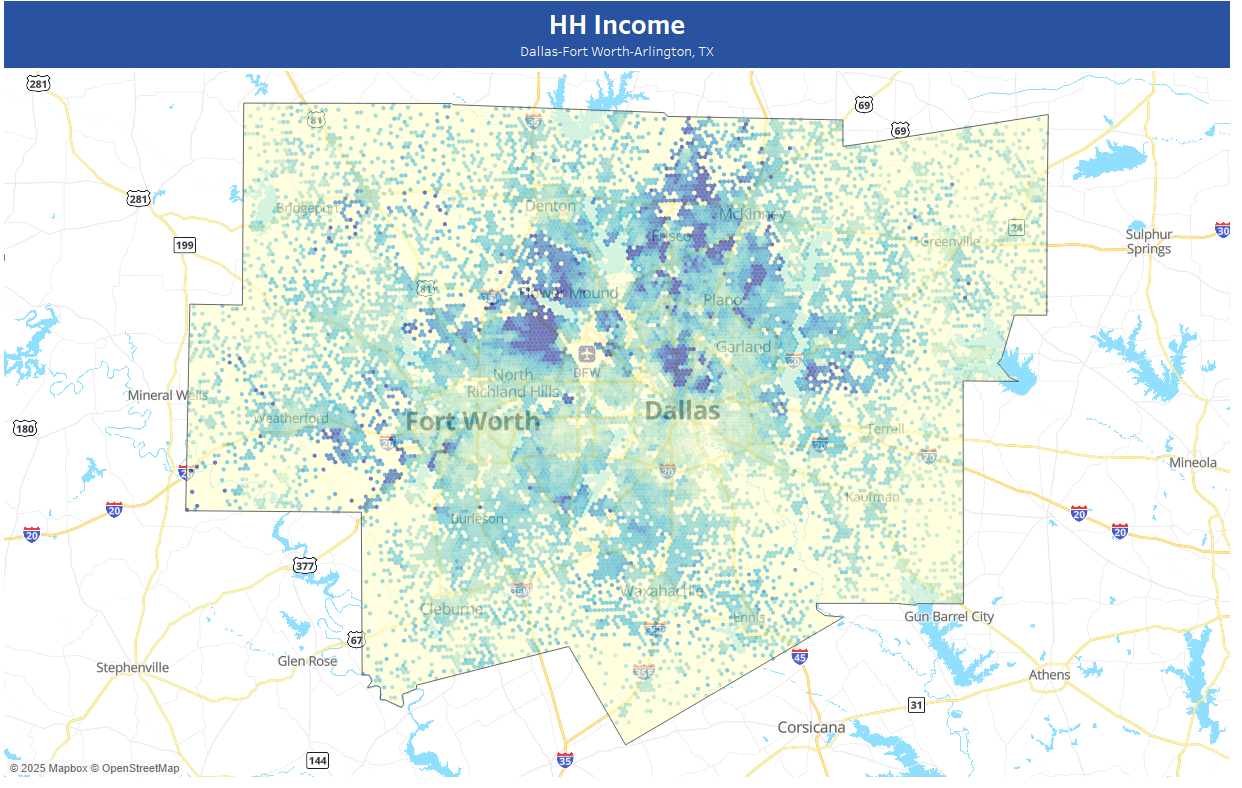
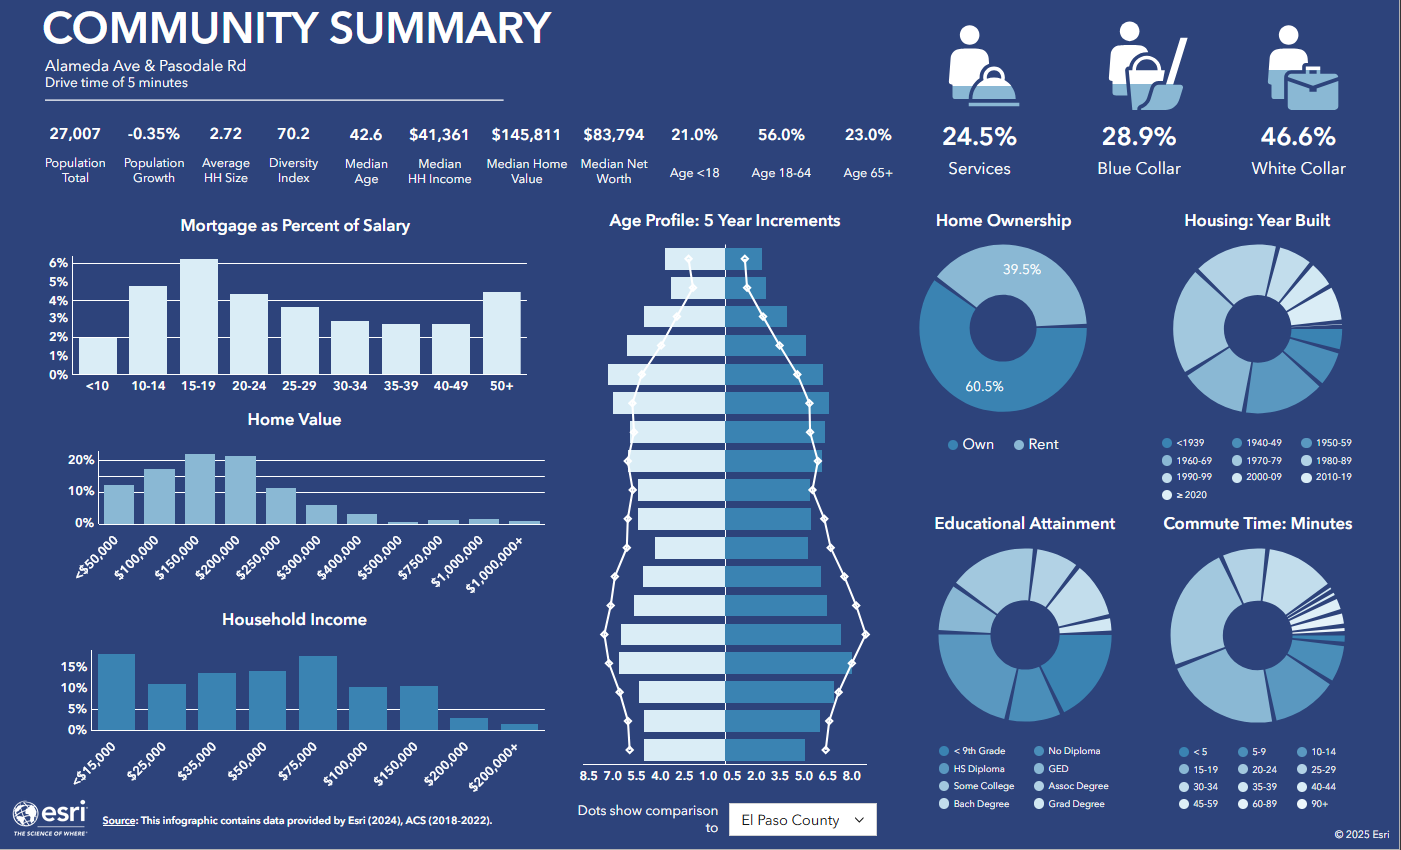
Break down the people behind the place. Break down age, income, education, household size, and more, so you can align your strategy with those who actually live or work there.
Make better location decisions by matching your business to the right customer base.
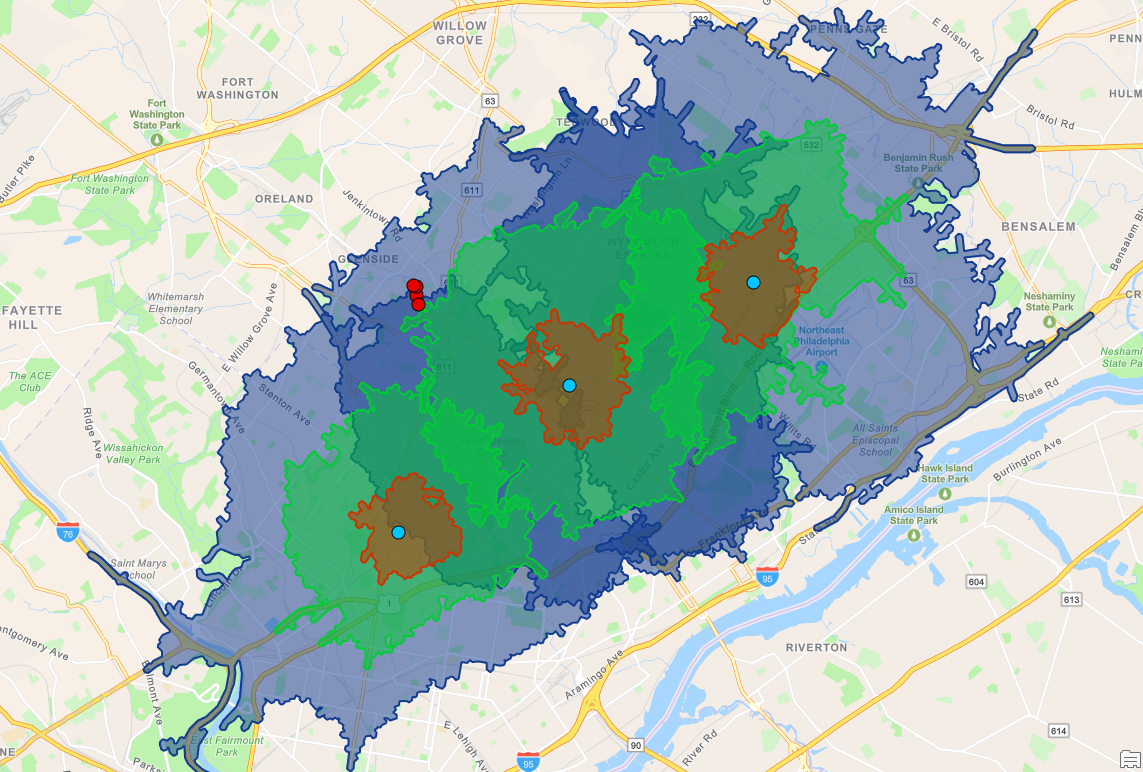
Quickly map drive-time zones around your facilities to reveal employee accessibility, customer reach, and site performance.
Optimize office, retail, or clinic locations based on real-world commute data to cut costs, improve satisfaction, and streamline regional expansion strategies.
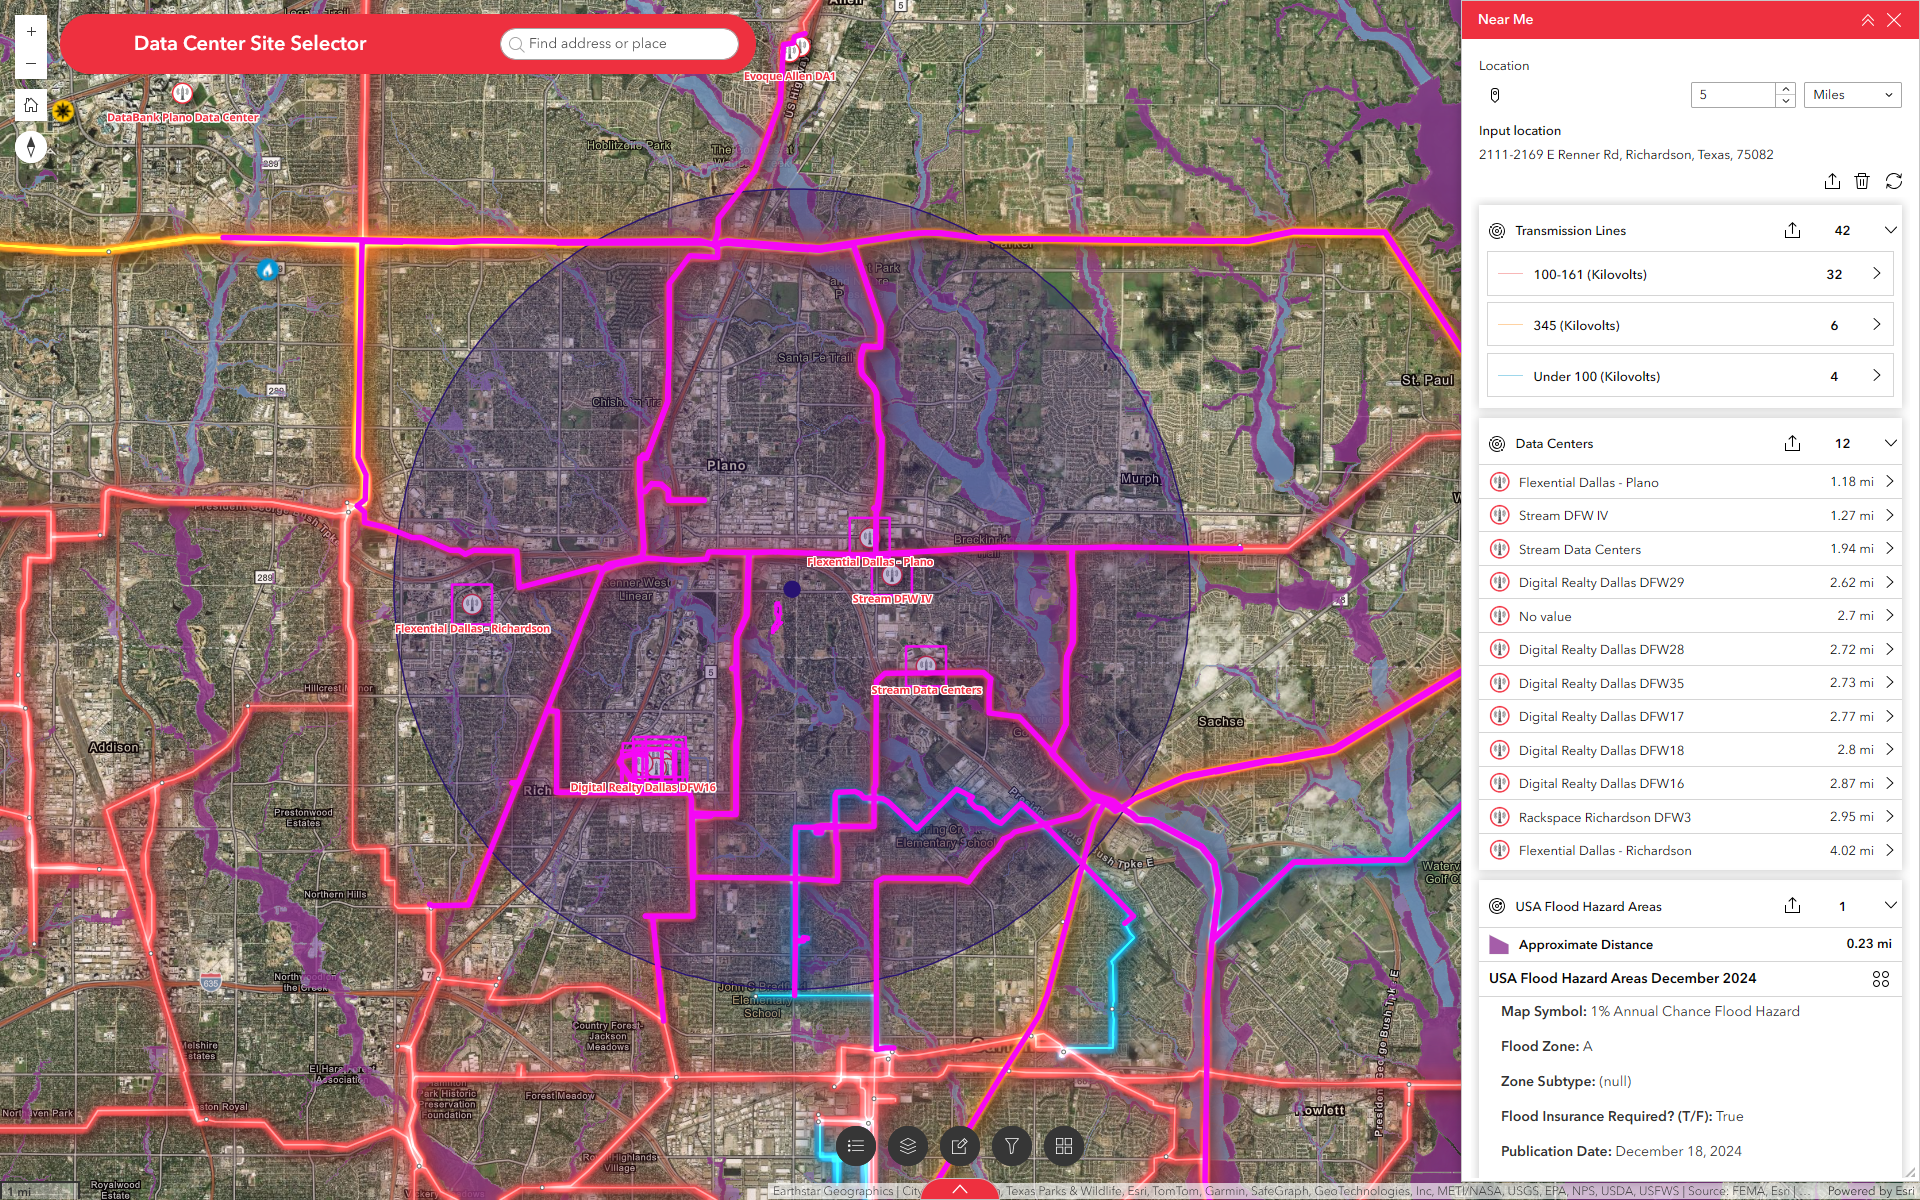
Not all locations are created equal. This tool helps you find the best spot by weighing the factors most influential to your business: things like rent, customer access, competition, or commute times.
Centralizing heterogeneous data into one authoritative hub eliminates version conflict, accelerates reviews, and turns disjointed reports into a clear, comparable portfolio narrative. With market rates, comps, incentives, labor, utilities, mobility, and lease obligations living together, decision-makers spend less time reconciling numbers and more time selecting the highest‑value options.
This reduces rework, shortens approval cycles, and creates audit-ready context so finance, legal, and operations align faster on both strategy and execution.
Operationally, a tenant‑built data model means fields, formulas, and KPIs reflect occupier economics rather than landlord priorities. Shared definitions, refresh schedules, and lineage tracking ensure consistency across markets and quarters. Role‑based permissions let teams see exactly what they need, while data quality rules flag anomalies before they pollute analysis. The result is a trusted foundation for negotiations, board materials, and quarterly business reviews—speeding decisions and raising confidence without sacrificing control.
Dashboards designed for both technical and non‑technical users remove adoption barriers and make analysis a team sport. Executives get intuitive overviews that drill into the “why,” while analysts can inspect comps, time series, and geospatial layers without leaving the screen. Scenario sliders allow users to tune assumptions—rent growth, absorption, deliveries, labor metrics—and watch the impact on NPV, cash flow, and timeline in real time.
This interactivity compresses meeting cycles because questions are answered in the room, not sent to a queue. Annotations, saved views, and side‑by‑side comparisons let finance, real estate, and operations agree on a shared set of facts and next steps. When stakeholders can test alternatives together—renew vs. relocate, consolidate vs. expand—alignment happens earlier, risks are surfaced sooner, and approvals move forward with fewer surprises and less back‑and‑forth.
Real‑time market signals layered over evergreen baselines keep decisions grounded in what is happening now, not last quarter. As rents move, vacancies shift, or deliveries add supply, dashboards refresh benchmarks so teams negotiate with current evidence. Evergreen baselines ensure trends remain comparable, allowing leaders to see whether a submarket is tightening or loosening and what that means for timing, concessions, and escalation positions.
This rhythm reduces reliance on stale assumptions that can erode savings or weaken leverage. Tenants gain the ability to act while opportunities are still available, pulling forward renewals to capture softening, delaying commitments during spikes, or sequencing expansions where supply and demand favor occupiers. The net effect is sharper counteroffers, fewer missed windows, and measurable value capture that stands up in investment committees.
Seeing “why here” requires more than a rent chart. Overlays of competitors, demand drivers, workforce and customer demographics, access routes, utilities, broadband, and risk indicators reveal the accurate strategic profile of each site. Heat maps indicate where ideal conditions cluster, while exclusion layers (e.g., flood, outage risk, regulatory constraints) eliminate high-risk areas from the shortlist before time and money are spent.
For multi-site networks, clarity prevents cannibalization and optimizes coverage, protecting top-line growth while controlling costs. Tenants can map service radii, delivery SLAs, commute patterns, and trade‑area spend to balance proximity with performance. The outcome is a portfolio that is not just cheaper or newer, but better positioned to win demand, attract talent, and stay resilient, so each lease supports the business model, not just occupancy needs.
A documented process with training, governance, and support scales reliably from a single pilot to a national footprint. Standardized data connectors, definitions, and QA checks ensure that each new market inherits the same logic, metrics, and visual patterns, reducing relearning and accelerating time-to-value. Playbooks define who does what, when, and with which approvals, so the experience feels familiar regardless of geography.
This repeatability lowers the total cost of ownership and de‑risks change management. New users onboard quickly, updates roll out predictably, and quarterly reviews follow a consistent cadence. Because the platform, process, and people scale together, tenants avoid the common pitfalls of fragmented tools and bespoke analyses. The result is consistent outcomes with faster cycles, stronger negotiations, and clearer governance, regardless of how rapidly the portfolio evolves.
Business Intelligence in Action

Director of Business Analytics
Taylor oversees the department while focusing on delivering engaging client presentations, implementing projects and contributing to the collective knowledge as the service line continues to expand.
Fill out the form below, and our team member will be notified.
Fill out the form below, and a member of our team will contact you shortly.
Fill out the form below, and our team member will be notified.